April 13, 2026
Planned and Impulse Buying Statistics: What Makes a Consumer Decide to Purchase?
In the low- or no-click era of marketing, understanding the consumer mindset around making purchases is all the more important. The cost of living is high, economic optimism seems low, and the spectre of AI haunts every conversation, from the job market to how Americans shop for everything from GLP-1 medications to their weekly grocery haul.
We wanted to dig deeper into the buyer’s mindset and get a better sense of consumer spending trends in 2026. Whether it’s impulse purchases or more planned buying behavior, we wanted to see what helps the average American purchase an item that isn’t a necessity– and what variables matter less than one would assume. To do this, we surveyed over 1,000 consumers, spread evenly across Gen Z, Millennials, Gen X, and Boomers, on their impulse buying as well as planned purchase research process.
Future Proof Your Performance Marketing for the AI Era
Get In Touch
Buying Behavior in Today’s Economy: 53% Tightening Budgets

The consumer economy is in a weird place: times are tight, but Americans are continuing to purchase, and purchase often. 41% report making nonessential purchases at least weekly, with 1 in 5 doing so several times a week. On the other hand, 53% said their overall budget is tighter in 2026 compared to the year before, with Gen X and Boomers leading the belt-tightening at 57% and 56% respectively. Gen Z, meanwhile, seems to be loosening up their budgets, perhaps a sign of career progression as the cohort ages into their thirties. Nearly 2 in 5 Americans also confess to living paycheck to paycheck, with little liquidity to make frivolous purchases.
Overall, consumers prefer shopping in person to online shopping at 57% to 43%; a sign of a smart purchase for most is obtaining good value for a given price. Only 28% prioritize investing in an item with lasting potential, and just over 1 in 6 only prioritize price. As price and value take the lead in importance, the significance of buying from a reputable brand is fading: just 2% define a smart purchase as coming from a quality brand.
Where do consumers like to shop? Popular locations for impulse purchases include major ecommerce sites (think Amazon) at 64%, followed by big box stores like Walmart or Target at 36%, grocery stores (34%), on vacation (22%), and small shops (22%). Top areas for planned purchases also show a large preference for major ecommerce sites, with 75% of voter share, followed by in person at a retail store (67%), big box stores (43%), a specific brand site (25%), and finally small shops (17%).
Impulse Buying Behavior: Triggers, Categories, and Spend

Despite tighter budgets and financial stress, Americans can’t resist an impulse purchase. 81% of consumers have made at least one impulse purchase so far in 2026, and for many, it’s even more: Americans average 7 purchases with a median spend of $50, or $350 in Q1 alone. When asked how much they spent on the single biggest impulse purchase of 2026, the response averaged to be $355.
What types of products are Americans impulse buying? For over half, it’s truly a little treat: food. Food (54%) is followed closely by clothing (53%), electronics (35%), shoes/accessories (26%), and home decor (21%). About 1 in 6 enjoy beauty products, media, or skincare products as well. Broken down by gender, women prefer to impulse buy clothing, food, and beauty products, while men opt for electronics, food, and clothing. Interestingly, electronics don’t even make the list for women.
What triggers an impulse purchase? For nearly two thirds, it’s price, followed by feeling deserving of a treat or reward (64%). Other top triggers include momentary good feelings, a simple “must have” moment, and overall aesthetic appeal.
Impulse Purchases Are Often Driven by Emotion

The momentary buzz of an impulse buy, along with rewarding oneself, showcase two major emotional motivators. However, it doesn’t end there: 21% make impulse purchases out of boredom, and 1 in 6 do so to relieve anxiety and/or stress. In fact, over 1 in 3 say their emotional state is most likely to trigger an impulse purchase.
As one could guess from the median spend on impulse purchases– $50– the vast majority consider impulse purchases to be small, with just 17% saying they make large impulse purchases.
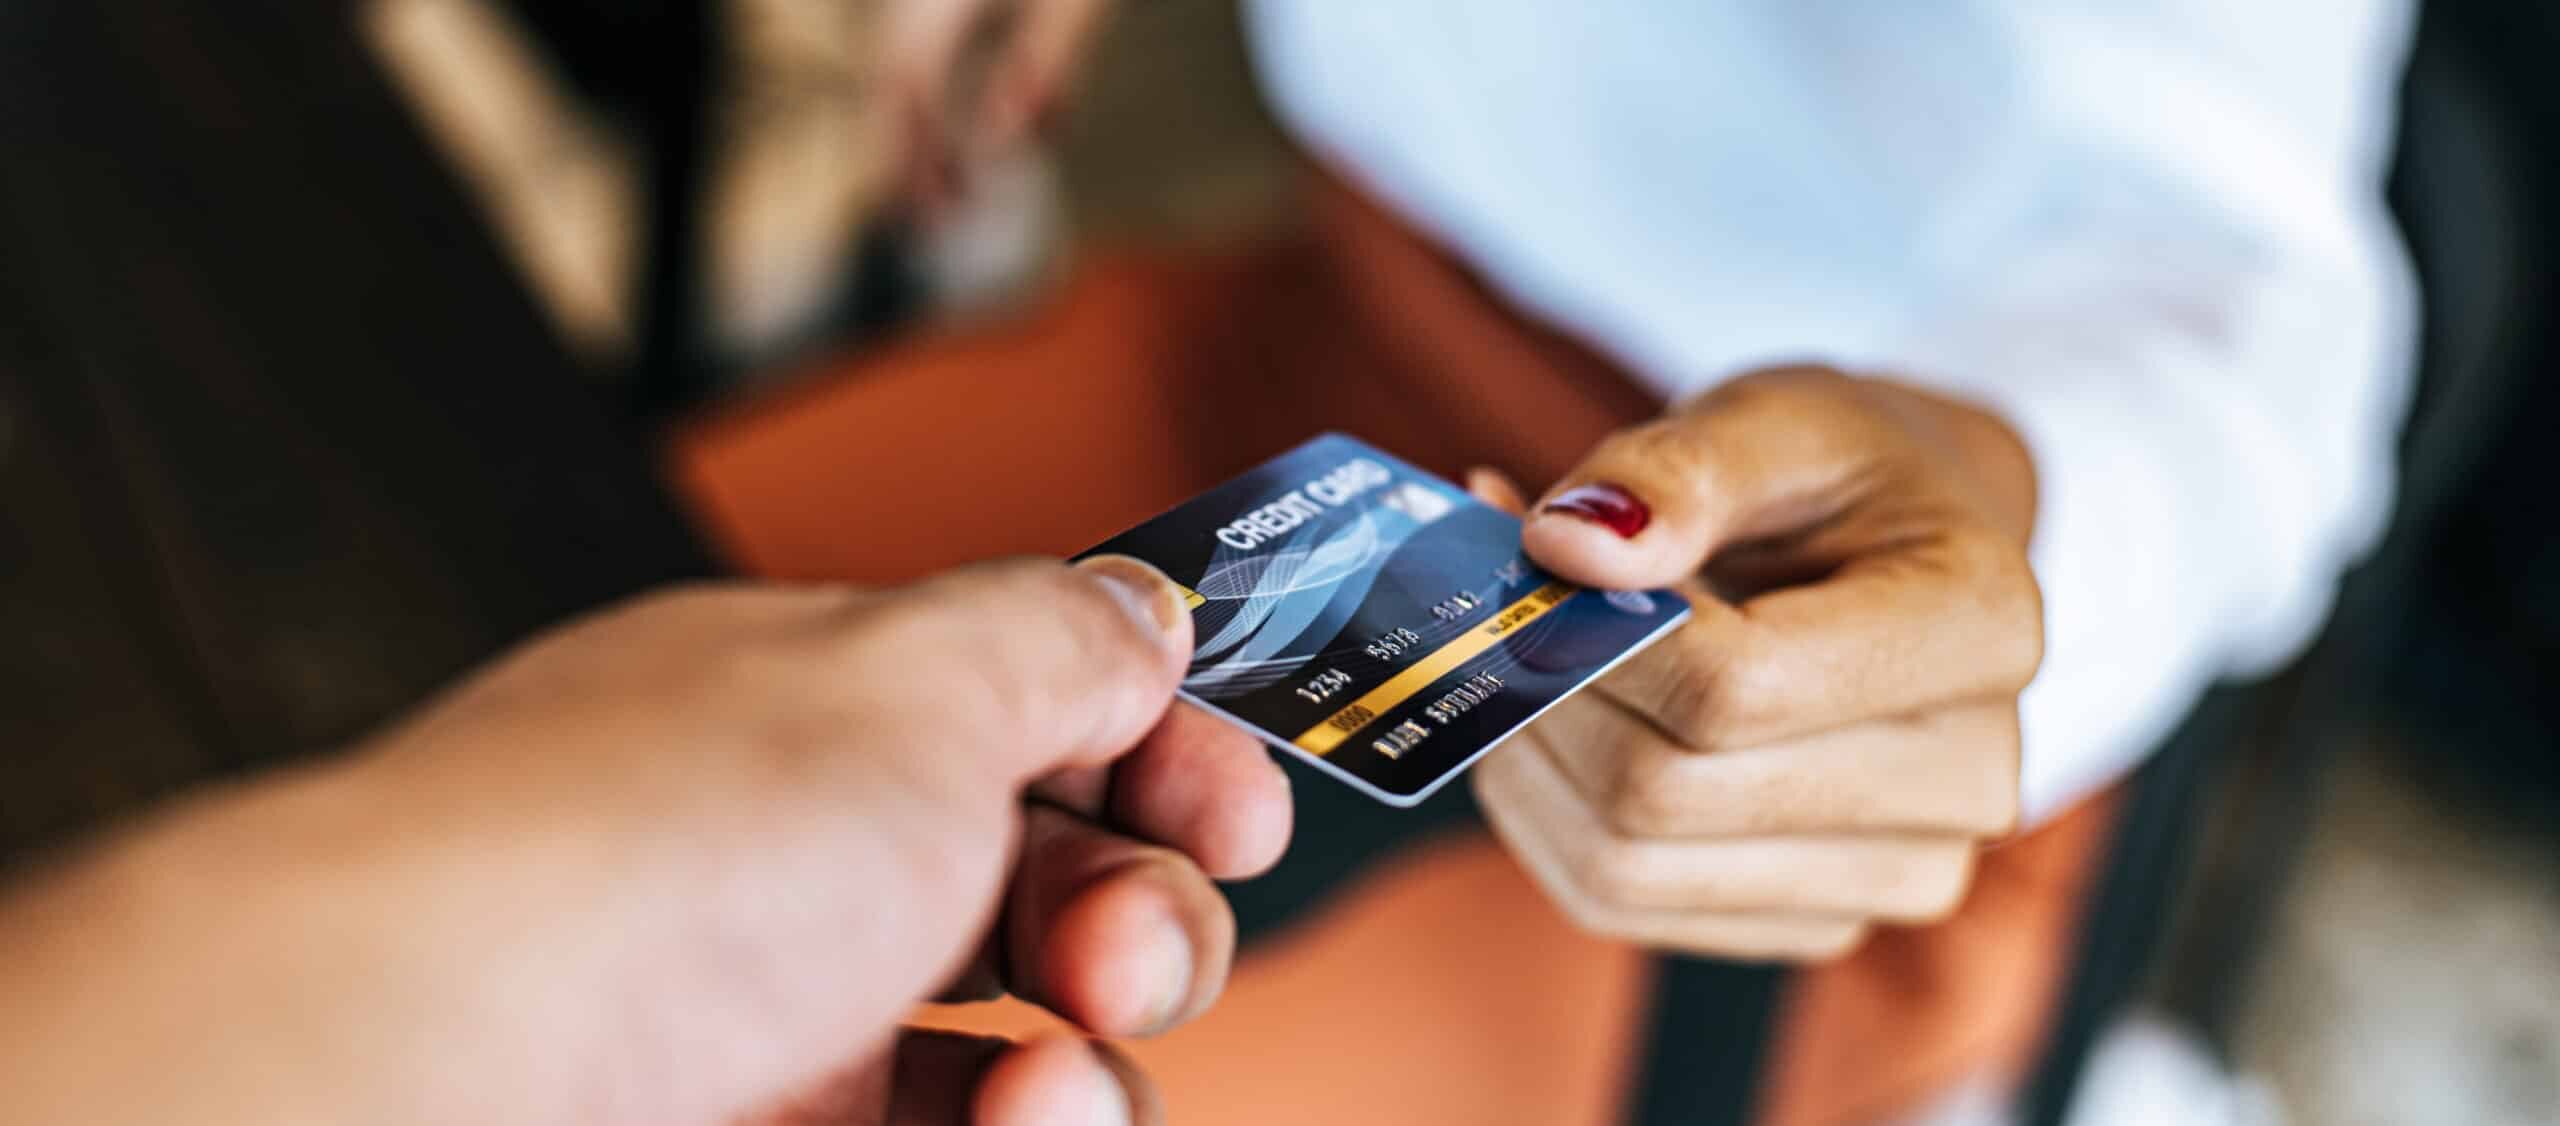
Top payment methods consumers use when they make impulse buys are debit cards (56%), credit cards (54%), and cash (31%). There is, however, an element of financial stress in play: 62% report regretting their purchases at least some of the time, and 34% report that impulse purchases cause them financial stress.
Social Media and Impulse Buying Behavior
Social media is already a source of entertainment, diversion, and emotional engagement: it’s no shock that 22% have made an impulse purchase on social media overall, but generationally, it’s all about Gen Z: 49% of the youngest major cohort have made an impulse purchase on social media. Comparatively, just 1 in 6 Millennials and Gen Xers have done the same. About 14% of consumers say they primarily make impulse purchases on social media.
The top platform for impulse buying behavior is TikTok (43%), followed by Instagram (27%) and Facebook Marketplace (15%). Over 1 in 3 follow a link posted by a creator, while 1 in 4 make their purchase while browsing a social media shop; just 15% pull the trigger for price alone.
Consumers Spent $1200 on Planned Nonessential Purchases in Q1 2026

Nonessential purchases are calculated affairs for cash-strapped Americans, but they’re still happening, to the tune of having spent an average of $1200 in Q1. How and why?
97% research products in some capacity before purchasing, and among top channels is AI. Nearly a third (29%) report an AI chatbot changed their mind about purchasing a product.” – Interestingly, just 1% of impulse buyers turned to AI to make impulse purchases; AI might fuel the research process but it doesn’t seem to harness the emotions of consumers the same way other platforms do.
Top product verticals consumers research in 2026 include electronics (73%), appliances (59%), and cars (57%); these big ticket items clearly inspire more care before paying. That said, even 45% research skincare products, and 34% research beauty products.
When researching, the majority take to Google search and AI overviews (87%), followed by review/affiliate sites (65%), social media (44%), friends/family (42%), and AI chatbots (28%). The process is not long; 77% purchase within a week of starting research, and 15% make their purchase same-day.
Top decision factors include level of need, price, and what reviews say; it’s also notable that 9% report emotional state as a trigger even for planned purchases. Most pay using debit (64%), followed by credit,cash, and gift cards; BNPL is present but diminished at just 5%.
The K Shaped Economy: Consumer Behaviors by Income Bracket

In analyzing survey results we saw traces of the “K-shaped” economy in the data. The “K-Shaped Economy” refers to an economy that diverges; half the population becomes downwardly mobile, while the other half enjoys increased financial security and higher incomes.
As would be expected, planned purchase spend increases with income brackets, from just $300 for those who make less than $40,000, all the way to $895 for those making more than $150,000 yearly. Interestingly, emotions play a larger role for less affluent consumers: 1 in 5 of those making $40,000 or less impulse buy as a way to relieve anxiety, while just 7% of those in the highest bracket do the same.
Impulse spending, however, is much more uniform: it’s $50 across brackets, except for the poorest, who instead spend a median of $25 on impulse buys. And what consumers are buying matters too: the poorest respondents are impulse buying food, while everyone else turns to clothing first.
With emotions driving purchases, having the right types of content on social media and in ads is crucial– and making sure AI is pushing your brand is growing ever more important as more consumers turn to AI for research before buying. Get in touch to see how we can help you find the right creators, the right posts, and the right tactics to be seen everywhere you need to be.
Methodology & Fair Use
In late March 2026, we surveyed 1,007 consumers weighted evenly across generations on their purchase habits. 50% were women, 49% men, and 1% nonbinary; ages ranged from 18-75 with an average age of 41.
For media inquiries, please contact media@digitalthirdcoast.net
Fair use: When using this data and research, please attribute by linking to this study and citing PartnerCentric.com.
Ready for better
This form is protected by reCAPTCHA and the Google Privacy Policy and Terms of Service apply.